Friday was the largest liquidation event at the nominal level in the history of cryptocurrencies. The scale of deleveraging is best understood by looking at open interest (OI), that is, the total value of outstanding futures and perpetual contracts that have not yet been settled.
Data from Glassnode shows that before Friday’s sell-off, bitcoin open interest stood at around $70 billion, an all-time high. This was equivalent to approximately 560,000 BTC in futures positions. Following deleveraging, OI fell to around $58 billion, or approximately 481,000 BTC.
Because the USD-denominated OI is influenced by the price of bitcoin, which fell from $122,000 to $107,000 during the event, looking at the OI in BTC terms provides a more accurate picture of the scale of the deleveraging.
Data from Glassnode shows that Friday marked the largest single-day deleveraging event for bitcoin in dollar terms, with more than $10 billion removed from OI in a single day. In BTC terms, it was the second largest deleveraging event on record, behind only the COVID crash in March 2020. However, it is important to note that bitcoin was trading near $5,000 back then, compared to $122,000, which significantly impacts the comparison in nominal terms.
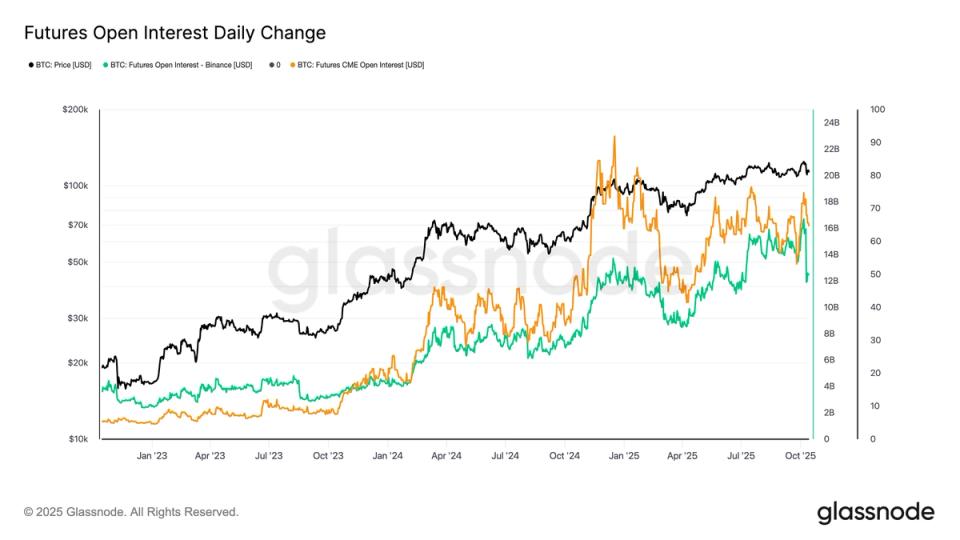
Breaking down the data by exchange rate shows where the deleveraging came from. The Chicago Mercantile Exchange (CME), the largest venue for bitcoin futures typically used by institutional investors, was little changed, with OI holding steady at around 145,000 BTC.
In contrast, Binance, the second-largest futures exchange, saw a significant decline, with OI falling from $16 billion (130,000 BTC) to $12 billion (105,000 BTC). This suggests that deleveraging was primarily concentrated in the crypto-native trading ecosystem, rather than being driven by traditional financial participants.
Historically, large single-day or short-term declines of this magnitude in open interest have often coincided with market lows. Previous examples include the March 2020 COVID crisis, the summer 2021 sell-off during China’s mining ban, and the November 2022 FTX collapse.


