According to CoinDesk Research’s technical analysis data model, ether It advanced with heavier-than-usual trading, then fell late after a rejection from the upper band, leaving a tighter range and a clear set of control points above and below.
Analyst Comment
- Crypto analyst Michaël van de Poppe said on X that Ethereum is the best ecosystem to invest in and that ether is close to reaching a new all-time high above $5,000.
- In layman’s terms: he’s arguing that developer activity, products, and network effects make the ethereum ecosystem attractive, and that the price action is approaching the kind of strength seen before all-time highs.
- How that fits into the current chart: The model shows buyers active on the way up, but sellers still protecting the $3,860 to $3,880 band. For a run into record territory, the first task would be a clean recovery of $3,880 and a follow-through above the session high of $3,887.35, steps that would show control returning to buyers near the top of the current range.
Technical Analysis Highlights
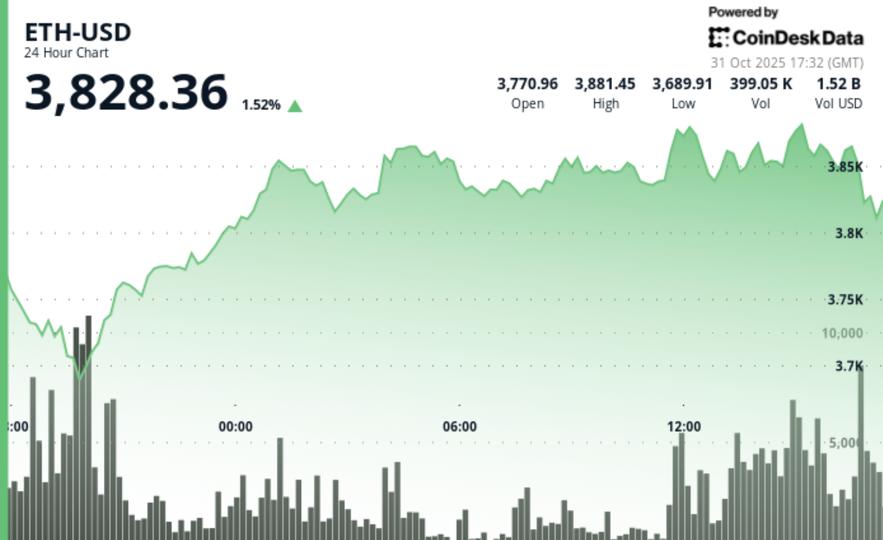
- Performance and participation: ETH +1.50% to $3,822.60 with volume +19.01% vs. seven-day average; CD5 deviation –0.06%.
- Intraday trajectory: From $3,771.27 to $3,822.78 within a range of $193.66, printing higher lows throughout the session.
- Momentum Peak: 2 pm UTC, volume 446.7K on momentum through $3860, peaking at $3887.35.
- Late Rejection: Final Hour –1.30% from $3,869 → $3,820 on volume of 21.8K (about 6x the session average for that phase), creating a lower high near $3,865.
Support and Resistance Map
- Support: zone between $3,680 and $3,720 that captured the weakness at the beginning of the session.
- Resistance: band from $3,860 to $3,880, with $3,880 as the psychological level.
- Short-term band: Trading was concentrated between $3,730 and $3,880 after the test of the upper band.
- Session benchmark: A recovery to $3,880 reopens the high of $3,887.35.
Volume image
- Overall: +19.01% versus the seven-day average indicates significant participation.
- On the advance: 446.7K at 2 pm UTC marked the strongest bullish impression.
- Towards close: 21.8K on dip from $3869 → $3820 shows supply breaking ceiling late.
What the patterns suggest
- Uptrend with a caution flag: Higher lows built a breakout, but lower high toward the close warns that sellers are still active near the top of the range.
- Range Behavior: With demand appearing on dips and supply between $3,860 and $3,880, $3,730 and $3,880 frame the short-term map.
- Next test point: Bulls would want a firm breakout and hold above $3,880; The bears will look for a loss of $3,720 to expose $3,680.
Objectives and risk framework
- If buyers press: Claim $3880 → mark $3887.35; Sustained strength maintains focus on the upper band.
- If sellers regain control: Below $3720 → $3680 becomes the next demand area.
- Tactical Lens: With participation high but resistance respected, many traders are waiting for a clear break between $3,730 and $3,880 before tilting further.
CoinDesk 5 (CD5) Index Context
- Range and Swing: CD5 rose from $1,878.33 → $1,901.52, reaching $1,924.98 before retreating to $1,901.52, in line with profit-taking at resistance across all major currencies.
Disclaimer: Portions of this article were generated with the help of artificial intelligence tools and were reviewed by our editorial team to ensure accuracy and compliance. our standards. For more information, see CoinDesk’s full AI policy.


