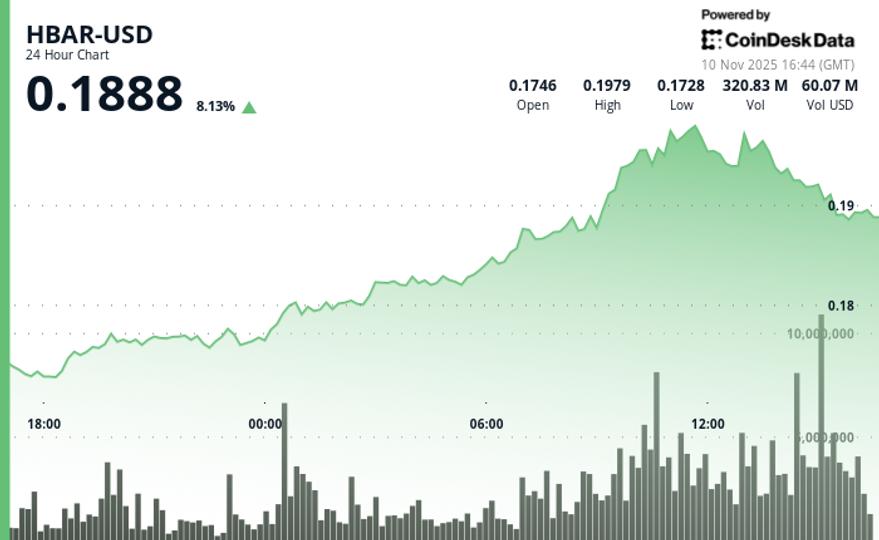
HBAR rose 4.62% to $0.188, outperforming the broader crypto market, as trading volume increased 24.2% above its weekly average.
The session’s price action pointed to genuine institutional participation rather than retail-driven speculation. HBAR’s 6.37% outperformance against the CD5 benchmark highlighted strong asset-specific demand catalysts.
Technically, HBAR advanced from $0.1736 to $0.1894, forming ascending trend lines marked by higher lows and demonstrating solid bullish momentum. The total range of $0.0255 reflected 13.2% volatility, while volume reached 215.6 million, confirming a decisive break above the $0.1950 resistance zone. Strong short-term support consolidated near $0.1880, suggesting a healthy pullback structure within an overall bullish setup.
However, a sharp reversal occurred in the last hour as institutional profit-taking triggered a technical correction. The price fell from a high of $0.1925 to $0.1892, breaking the support at $0.1911 at almost triple the average hourly volume.
The failed breakout attempt above $0.1920 established lower highs and bearish intraday channels, with temporary support now forming near $0.1890, a level traders should monitor closely as the market digests recent gains.
Key technical levels indicate mixed outlook for HBAR
Support/Resistance: Primary support is at $0.1880 with resistance in the $0.1920-$0.1950 zone
Volume analysis: The 24.2% increase above the weekly average confirms institutional flows, while the increase of 10.8 million per hour shows profit taking
Chart Patterns: The ascending trend lines developed before the late reversal created a bearish channel structure.
Objectives and risk/reward: Break above $0.1950 targets $0.200 level, while risks of failure at $0.1880 decline towards $0.1750
Disclaimer: Portions of this article were generated with the help of artificial intelligence tools and were reviewed by our editorial team to ensure accuracy and compliance with our standards. For more information, see CoinDesk’s full AI Policy.


