Memecoin broke below the critical $0.1720 level on heavy volume as sellers dominated the London session, testing the resistance of long-term technical support.
News background
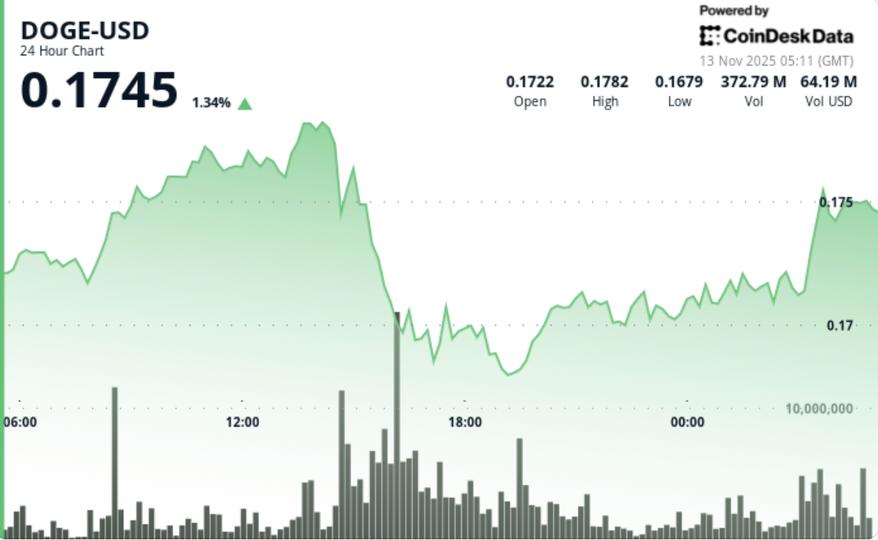
Dogecoin extended its decline on Tuesday, falling 5.5% from $0.1831 to $0.1730 as bearish momentum accelerated in European trading hours. The strong move developed within a range of $0.0121 as price action confirmed a textbook formation of lower highs and lower lows.
The collapse accelerated at 14:00 GMT, when trading volume skyrocketed to 500.6 million tokens, 77% above the 24-hour average of 283 million. Heavy selling emerged at the $0.1789 resistance zone, triggering a cascade through successive support levels until buyers stabilized the move near $0.1719.
Despite a modest stabilization at the end of the session, DOGE remained near the lows. Attempts to rally towards $0.1732 faced immediate selling pressure, while high activity of 12.5 million tokens per hour during the recovery phase suggested distribution rather than accumulation.
Price Action Summary
DOGE’s session structure reflects deteriorating momentum with decreasing support strength. Failure to reclaim the $0.1789 resistance validates a short-term bearish trend, while the compression around $0.1730 highlights uncertainty among short-term traders.
The $0.1719 zone absorbed multiple tests, forming a fragile base that may define the next pivot for directional traders. The gradual reduction in volume from high levels suggests temporary exhaustion of sellers, but without follow-up buying, the market remains vulnerable to another test of the downside.
Technical analysis
Without major fundamental triggers, the price action remains purely technical. DOGE’s drop below its short-term moving averages reinforces the broader bearish bias that has persisted since early November. The hourly RSI sits near 38, indicating mildly oversold conditions, but not capitulation yet.
Market analyst Kevin (@Kev_Capital_TA) highlights the 200-weekly EMA near $0.16 as Dogecoin’s structural “line in the sand.” That level has held for six previous retests since the summer, marking the boundary between a cyclical pullback and a long-term trend reversal.
A decisive close below $0.17 would change the decidedly bearish sentiment, while a sustained defense above $0.1720 could allow for a short-term consolidation phase or a relief bounce towards $0.1760.
What traders should know
The immediate focus is whether the $0.17 level can hold under continued pressure. Institutional order flow metrics suggest systematic risk reduction rather than panic liquidation, leaving room for a technical rally if volume declines further.
Failure of the support group between $0.1720 and $0.1719 could expose the zone between $0.1650 and $0.1600, where the weekly moving average lies as the last structural support.


