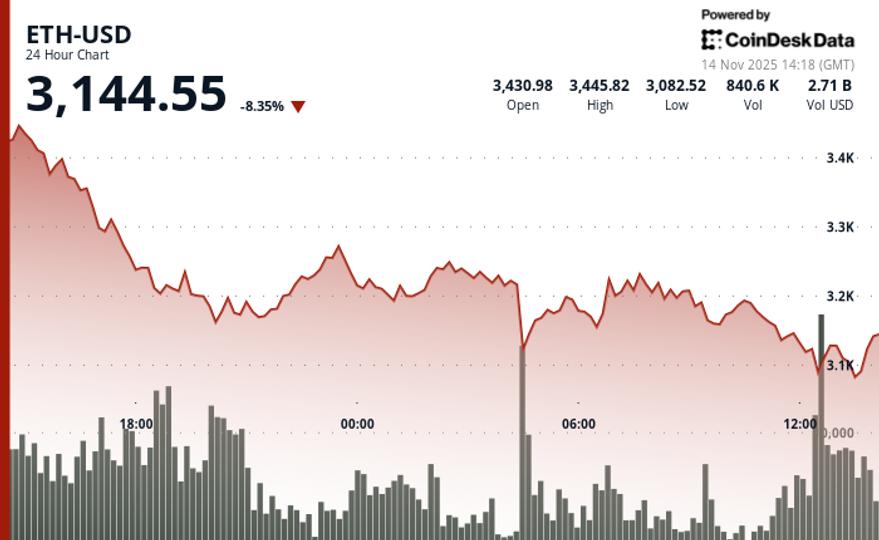
Ethereum ether fell sharply from Thursday to Friday, dropping more than 10% from peak to trough, a broad market cryptocurrency sell-off accelerated with bitcoin breaking below the $100,000 level.
The second-largest cryptocurrency fell from $3,565 on Thursday to $3,060 early Friday, erasing last week’s entire bounce. It recently stabilized just below $3,200, still down about 8% in the last 24 hours.
The move coincided with a widespread sell-off in US markets with stocks and bonds falling along with cryptocurrencies. The US government shutdown, which just ended, affected liquidity conditions. Also adding to the pressure is the growing likelihood that the Federal Reserve will leave rates unchanged during its December meeting.
Since the Federal Reserve’s late October meeting, when Chairman Jerome Powell poured cold water on the almost universally expected rate cuts in December, U.S.-listed spot ether ETFs have seen net outflows of $1.4 billion, Farside Investors data shows. Thursday’s outflow of nearly $260 million was the biggest single-day drain in a month.
On top of that, long-term holders are also heading towards the exit door. Glassnode blockchain data showed that long-term holders spanning 3 to 10 years accelerated sales to approximately 45,000 ETH (around $140 million at current prices) daily on a 90-day moving average, the highest distribution pace since February 2021.
Blockchain data also suggests deteriorating fundamentals. Monthly active addresses on the network have fallen to 8.2 million, down from more than 9 million in September, while transaction fees over the past month have collapsed by 42% to just $27 million, Token Terminal data shows.
Key technical levels to consider
ETH broke a critical support level at $3,325, establishing a clear bearish trend with consecutive lower highs, CoinDesk Research’s technical analysis model suggested.
- Support/Resistance: Primary support is at $3,080 with secondary floors at $3,050 and $2,880. Key resistance forms at $3,330 (old support), $3,500 (main pivot), and $3,650 (descending channel highs).
- Volume Analysis: Sales peaked at 641,103 during the breakout at $3,325, 71% above 24-hour norms. Subsequent volume fell to 80% of the 7-day averages, indicating possible exhaustion.
- Chart Patterns: ETH broke out of its April ascending channel, creating a bearish structure with lower highs. The consolidation range of $3,077-$3,146 suggests a possible base formation.
- Targets and Risk/Reward: Breaking the $3,050 support exposes a downside to $2,880, while reclaiming $3,563 is necessary for bullish momentum. A decisive push above $3,500 points to between $3,650 and $3,800.
Disclaimer: Portions of this article were generated with the help of artificial intelligence tools and were reviewed by our editorial team to ensure accuracy and compliance with our standards. For more information, see CoinDesk’s full AI Policy.


