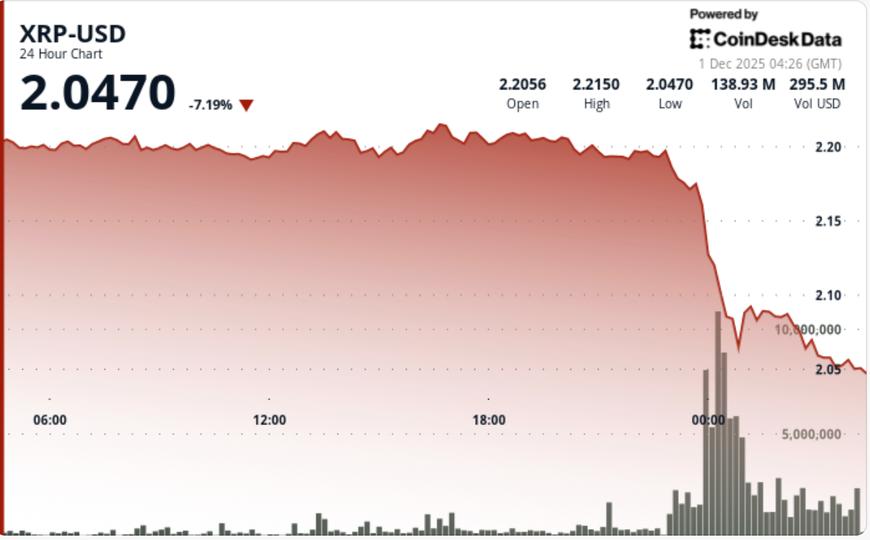
XRP plunged 7% to $2.05 as a violent wave of institutional selling broke critical support levels, overcoming strong ETF inflows and forcing the token back into its November correction range.
• XRP spot ETF inflows hit $666.6 million this month, led by 21Shares’ new listing on TOXR
• Currency supply fell 45% in 60 days, showing large-scale accumulation.
• Whale Wallets Added 150 Million XRP Since Nov 25 Despite Latest Breakout
• Selling pressure intensified on Tuesday as risk assets weakened broadly.
Despite the expansion of institutional infrastructure around XRP, short-term flows turned sharply bearish. ETF demand seemed unable to offset the sharp sell-off in derivatives and large lot selling during the afternoon session. Market liquidity narrowed as broader crypto benchmarks softened, accelerating the decline.
The drop below $2.16 marked a decisive failure of XRP’s recent consolidation structure. That level served as a pivot for the past three weeks, making its loss a key sign that sellers regained momentum.
The move pushed XRP back into a descending channel defined by consecutive lower highs of $2.38, $2.30, and $2.22. The structure reflects increasing control by the bears, with each bounce producing a decreasing follow-through.
The volume confirmed the legitimacy of the breakdown: it increased to 309.2 million, more than 4.6 times the moving average. This level of activity typically indicates institutional outflows rather than noise. Multiple intraday retests of $2.05, each accompanied by spikes over $3 million, showed buyers defending the psychological bottom, but with no confirmed reversal.
Momentum indicators reflect deep short-term oversold conditions, but not enough divergence to indicate a full corrective wave. The $2.05 to $2.00 area remains critical; Missing it exposes the broader November demand band between $1.80 and $1.87.
XRP fell from $2.21 to $2.05 during a sharp drop of 7.2%. The most aggressive selling came after they gave up $2.16, triggering cascading liquidations until the close. The volume increased to 309.2 million, 464% more than the daily average, confirming intense distribution.
The hourly candlesticks formed a descending channel with lower highs and tight range behavior. Multiple failed recoveries near $2.12 indicated persistent selling pressure. Buyers repeatedly absorbed dips to $2.05, but without strong enough momentum to reclaim the broken support.
• Maintaining $2.05 is essential; a breakdown exposes between $1.87 and $1.80 below
• It is necessary to recover $2.16 to invalidate the bearish structure.
• ETF inflows support long-term outlook, but short-term tape remains intense
• Watch for bullish divergence in hourly RSI and MACD as early reversal signals.
• A high volume recovery between $2.12 and $2.16 would indicate accumulation is resuming


