Wednesday, December 18, will go down in history as a day of market panic sparked by the Federal Reserve’s 25 basis point interest rate cut and Chairman Jerome Powell’s hawkish outlook.
Bitcoin (BTC) briefly fell below $100,000; US stocks fell about 3%, while the dollar index (DXY) soared to a two-year high of 108, continuing to put pressure on currencies around the world.
The most significant move came from the CBOE Volatility Index (VIX), which soared 74%, marking the biggest one-day jump in Wall Street’s so-called fear gauge since February 5, 2018. It was also the second biggest increase in its history. The VIX serves as a measure of market fear and expected volatility over the next 30 days.
Historically, significant spikes in the VIX have marked local lows for both bitcoin and the S&P 500.
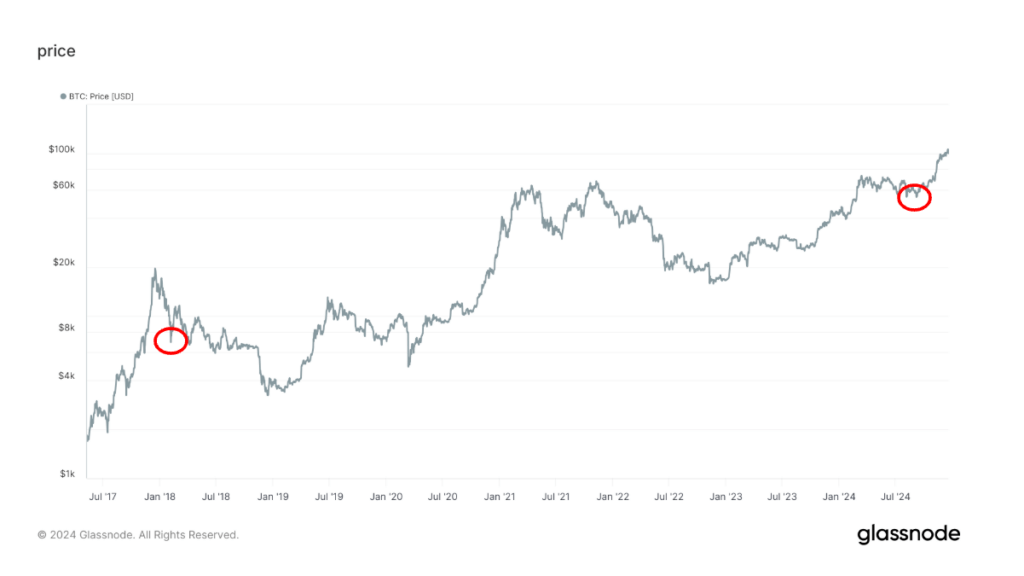
When looking at the top three one-day swings in the VIX, the first occurred on February 5, 2018, when it rose 116%. That day, bitcoin plummeted 16% to $6,891, which turned out to be a local low. By February 20, prices had recovered to over $11,000.
The second largest increase in the VIX occurred on December 18, recording a 74% increase.
The third largest increase occurred on August 5, 2024, during the easing of the yen carry trade, when the VIX jumped 65%. On that occasion, bitcoin fell 6% to hit a local bottom around $54,000 and rose again to over $64,000 on August 23.
A similar pattern has steadily developed in the S&P 500 over the years, data shared by Charlie Bilello, chief market strategist at Creative Planning, shows.
Let’s see if history repeats itself. At press time, BTC was trading above $102,000 while S&P 500 futures were pointing to a positive open with a 0.37% gain.


