Bitcoin The 11% drop last week may be the least of investors’ worries. It’s a price of around $58,000, another 25% below current levels, that you should pay attention to.
While the largest cryptocurrency’s recent drop, biggest weekly drop since March 2025, and failure to attract buyers has many holders worried about another so-called crypto winter, there is still a painful journey ahead before it reaches the potential silver lining that is the 200-week moving average (WMA).
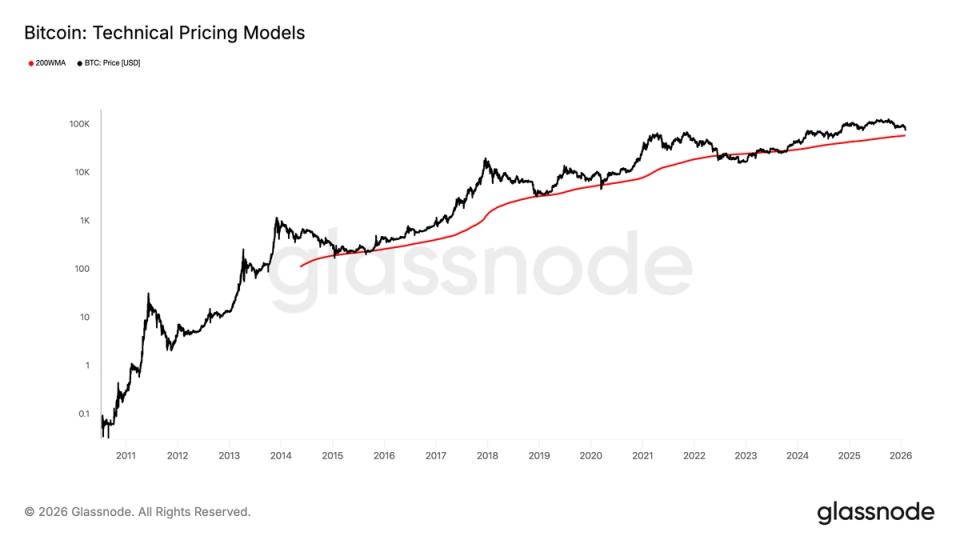
BTC’s average closing price over the past 200 weeks is a widely used long-term momentum indicator and a basis for bitcoin’s traditional four-year cycle. It has marked a market bottom in all previous cycles and is currently at $57,926.
Historically, bitcoin has often peaked in the fourth quarter of the fourth cycle year. This time, it hit an all-time high of $126,000 in October and is currently around 40% below that high.
There may be another slide on the table.
Last week’s decline took bitcoin below the Ichimoku Cloud, a technical indicator that measures momentum, support and resistance. When the price stays above the cloud, that indicates a strong uptrend, with strong bullish momentum. When the price falls below that level, the market becomes anemic, lacking strength and exposed to prolonged weakness, like a human body lacking iron.
Bitcoin just crossed below the cloud on the weekly chart, a bearish reversal that has historically signaled the start of the deepest and most painful phases of the bear market.
It also appears to broadly follow the four-year cycle theory, driven by the halving schedule that reduces new supply by about 50% every four years and is partly the reason for cyclical bull and bear markets.
In the 2015 bear market, bitcoin traded slightly above $200 and consistently used the 200-WMA as support. During the 2018-2019 bear market, the 200-WMA hovered just above $3,000 and again acted as support, with a brief breakout during the Covid-driven market crash in March 2020.
In the previous cycle, bitcoin fell below the 200-WMA in June 2022, to levels below $22,000, and remained there for an extended period. The price did not reclaim the 200-WMA line until October 2023, confirming its role as a long-term trend support line.
While there is no guarantee, the recent price drop below the Ichimoku Cloud indicates that another sustained phase of the bear market may be imminent, but at least there is a time-tested support level to provide some joy.


