The two things most cryptocurrency investors are wondering is how much lower Bitcoin can go. will go and how much longer this bear market could last.
The price pain aspect has been widely discussed, but the time-based dimension is another question in itself.
Price pain refers to sharp declines or volatility that force participants to exit their positions, while timing pain reflects slow, range-bound conditions that exhaust both bulls and bears due to a lack of direction.
Bitcoin is currently trading below $66,000, down more than 3% in the last 24 hours and about 45% below its all-time high from October, a nearly six-month bear market.
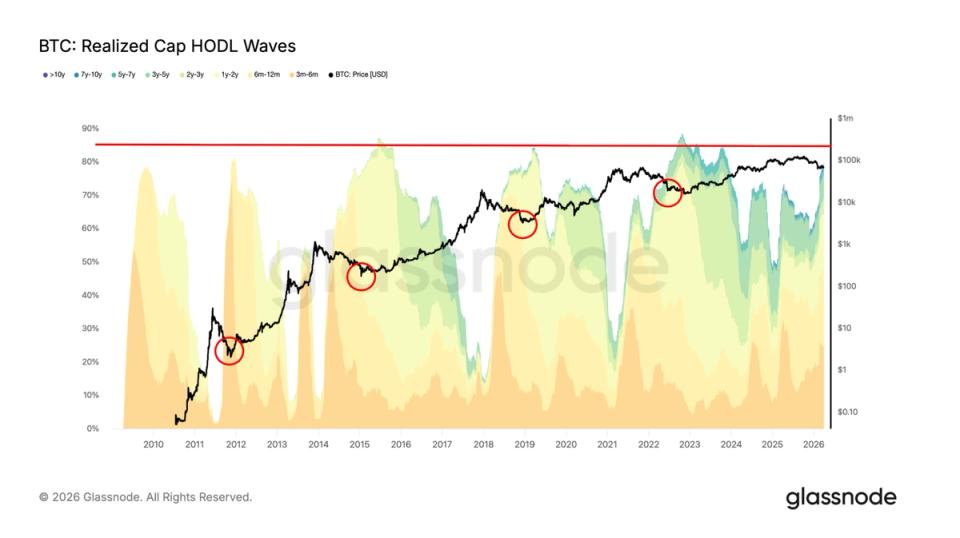
One indicator that points towards continued pain over time is Glassnode’s Realized Cap HODL waves. This metric groups the supply of bitcoins based on when the coins were last moved, with each band representing different holding periods, and weights them by the realized price, the average price at which the coins were last traded on the chain.
Historically, bear market lows have coincided with long-term holders, those who hold their holdings for six months or more, controlling at least 85% of the supply. Typically, price lows form first, and only several months later does the supply of long-term holders approach these high levels, indicating that these investors bought at low prices and held onto their shares in the bear market.
Currently, long-term holders account for around 80% of the supply. If this trend continues, the market may be approaching a bottoming phase, although several months of consolidation are likely still ahead.


