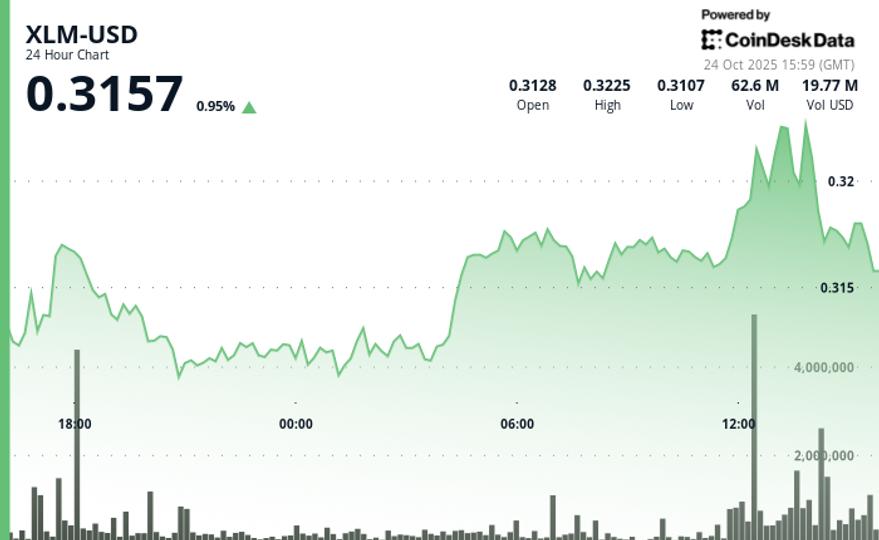
Stellar’s native token, XLM, rose from $0.3131 to $0.3210 in the last 24 hours, advancing 2.5% and confirming an upward trend pattern. The rally was supported by a series of higher lows of $0.3106, $0.3118 and $0.3149, reflecting consistent buying momentum throughout the sessions.
At midday UTC on October 24, trading activity increased sharply, with volume skyrocketing to 74.39 million (roughly 350% above the 24-hour average), driving XLM to a session high of $0.3229. The move confirmed a bullish break above the $0.3170 level before encountering resistance at $0.3230. Support held near $0.3150, defining the day’s trading range of $0.0133, or about 4.2% in volatility.
Short-term charts show the token moving away from its peak, falling 0.6% to $0.321 as volume surpassed 2.9 million during key distribution phases. The pullback formed a descending triangle pattern, suggesting short-term profit-taking rather than a change in overall momentum.
With no major fundamental catalysts driving the move, technical signals remain the focus. The increase in volume underlines institutional participation, while the pullback to the 38.2% Fibonacci retracement near $0.321 points to a possible base formation. Holding this level could position XLM for upside continuation if buying volume resumes.
Key Technical Levels Signal Consolidation for XLM
Support/resistance analysis
- Primary resistance is confirmed at the $0.3230 level with strong selling pressure.
- Key support was established near $0.3150 from the previous consolidation phases.
- Immediate support formed at $0.321 from recent basing patterns.
Volume analysis
- The exceptional volume increase of 74.39 million provided confirmation of the break above $0.3170.
- The distribution volume of over 2.9 million during the pullback indicated professional profit taking.
- Volume patterns suggested institutional involvement during key price levels.
Chart Patterns
- Uptrend structure with higher lows at $0.3106, $0.3118 and $0.3149.
- Descending triangle formation observed during the pullback with a sequence of lower highs.
- The alignment of the 38.2% Fibonacci retracement supported the base formation thesis.
Objectives and risk management
- The bullish target points to resistance at $0.3230 in case of volume expansion above $0.3170.
- Downside risk is contained above the $0.3150 support to maintain the trend structure.
- Risk/reward favors continuation given strong volume confirmation and retracement levels.
Disclaimer: Portions of this article were generated with the help of artificial intelligence tools and were reviewed by our editorial team to ensure accuracy and compliance. our standards. For more information, see CoinDesk’s full AI policy.


