Dogecoin broke through key resistance with its strongest volume in weeks, signaling retail-driven momentum even as whale activity fell to multi-month lows.
News background
- Dogecoin’s latest move unfolded against a backdrop of modest but steady ETF participation.
- The two recently launched US spot Dogecoin ETFs (Grayscale’s GDOG and Bitwise’s BWOW) recorded $177,250 in net inflows on December 3, bringing cumulative inflows since their launch to $2.85 million, according to data from SoSoValue.
- While not explosive, the flows indicate early-stage adoption among traditional investors as regulated DOGE products begin to establish themselves. The broader memecoin market remained depressed, but continued ETF demand provided a small but notable tailwind as DOGE attempted to reclaim key technical levels.
Technical analysis
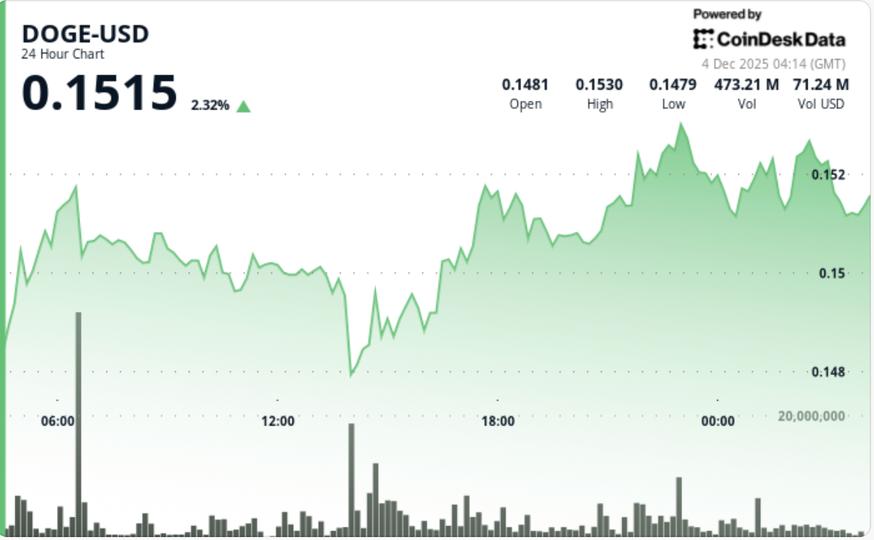
- DOGE’s structure strengthened noticeably as the price confirmed an ascending channel built through three higher lows of $0.1469, $0.1488, and $0.1512. This pattern reflects sustained accumulation, with volume expanding sharply on each up leg and contracting during pullbacks – the exact behavior traders look for when differentiating true trend reversals from noise.
- The break above $0.1505 marked the first removal of resistance since late November. Tuesday’s volume expansion (triple the daily average) reinforced the legitimacy of the move.
- Despite declining whale participation, the chart shows constructive momentum: upward sloping support, increasing amplitude on each breakout attempt, and clean reactions to intraday declines.
- Importantly, DOGE maintains structural integrity above the $0.1470 support band. This zone now acts as a technical pivot for continuation and defines the lower boundary of the ascending channel.
- On a higher time frame, the $0.138 region remains the main structural bottom that aligns with the 0.382 Fib Retracement and the 200-week moving average, levels that continue to attract long-term buyers.
- DOGE opened with steady accumulation before breaking the $0.1505 resistance. The rally accelerated around 14:00 GMT as the volume surge reached 874.7 million tokens. The price briefly retreated to $0.1513 before buyers reasserted control, confirming the new support.
- The intraday action showed clean supply absorption at each higher low, while the upper boundary of the channel guided the rallies towards the $0.1530 region. The session closed within the upper half of the day’s range, indicating that the bulls maintained dominance.
• $0.1470 is now the key support level; holding it preserves the breaking structure
• The immediate bullish target is $0.1530, with $0.1580-$0.1600 as the next resistance band.
• Volume confirmation remains essential – a drop below average may delay continuation
• Retail-driven rallies can accelerate quickly but also fade without institutional reinforcement
• A loss of $0.1470 risks a deeper pullback towards $0.1430 and, in extreme cases, the macro support of $0.138.
What do technicians suggest for DOGE?
- The market structure is showing early signs of a momentum shift, supported by mixed but improving indicator signals. Analyst Ali Martinez highlighted a new “buy” signal on Dogecoin’s weekly chart using the TD Sequential indicator, a tool designed to identify trend exhaustion and potential reversal points.
- Historically, sequential TD “buy” signals on DOGE have preceded strong multi-week rallies, making the emergence of a new signal notable as the coin tests the upper limit of its ascending channel.
- However, not all indicators align clearly. TradingView’s Bull Bear Power tool, which measures the balance between bullish and bearish pressure, issued a sell signal, suggesting that sellers still maintain influence during intraday swings.
- In contrast, the MACD indicator, which tracks momentum through moving average convergence and divergence, turned bullish when the MACD line crossed above its signal line, which is typically interpreted as bullish momentum.
- Taken together, the mixed indicator profile implies that DOGE is in the early stages of a possible trend transition, where bullish momentum is emerging but not yet dominant.
- Traders are watching for confirmation through sustained closes above resistance and increased volume, both of which would validate the TD Sequential signal and negate short-term bearish readings.


