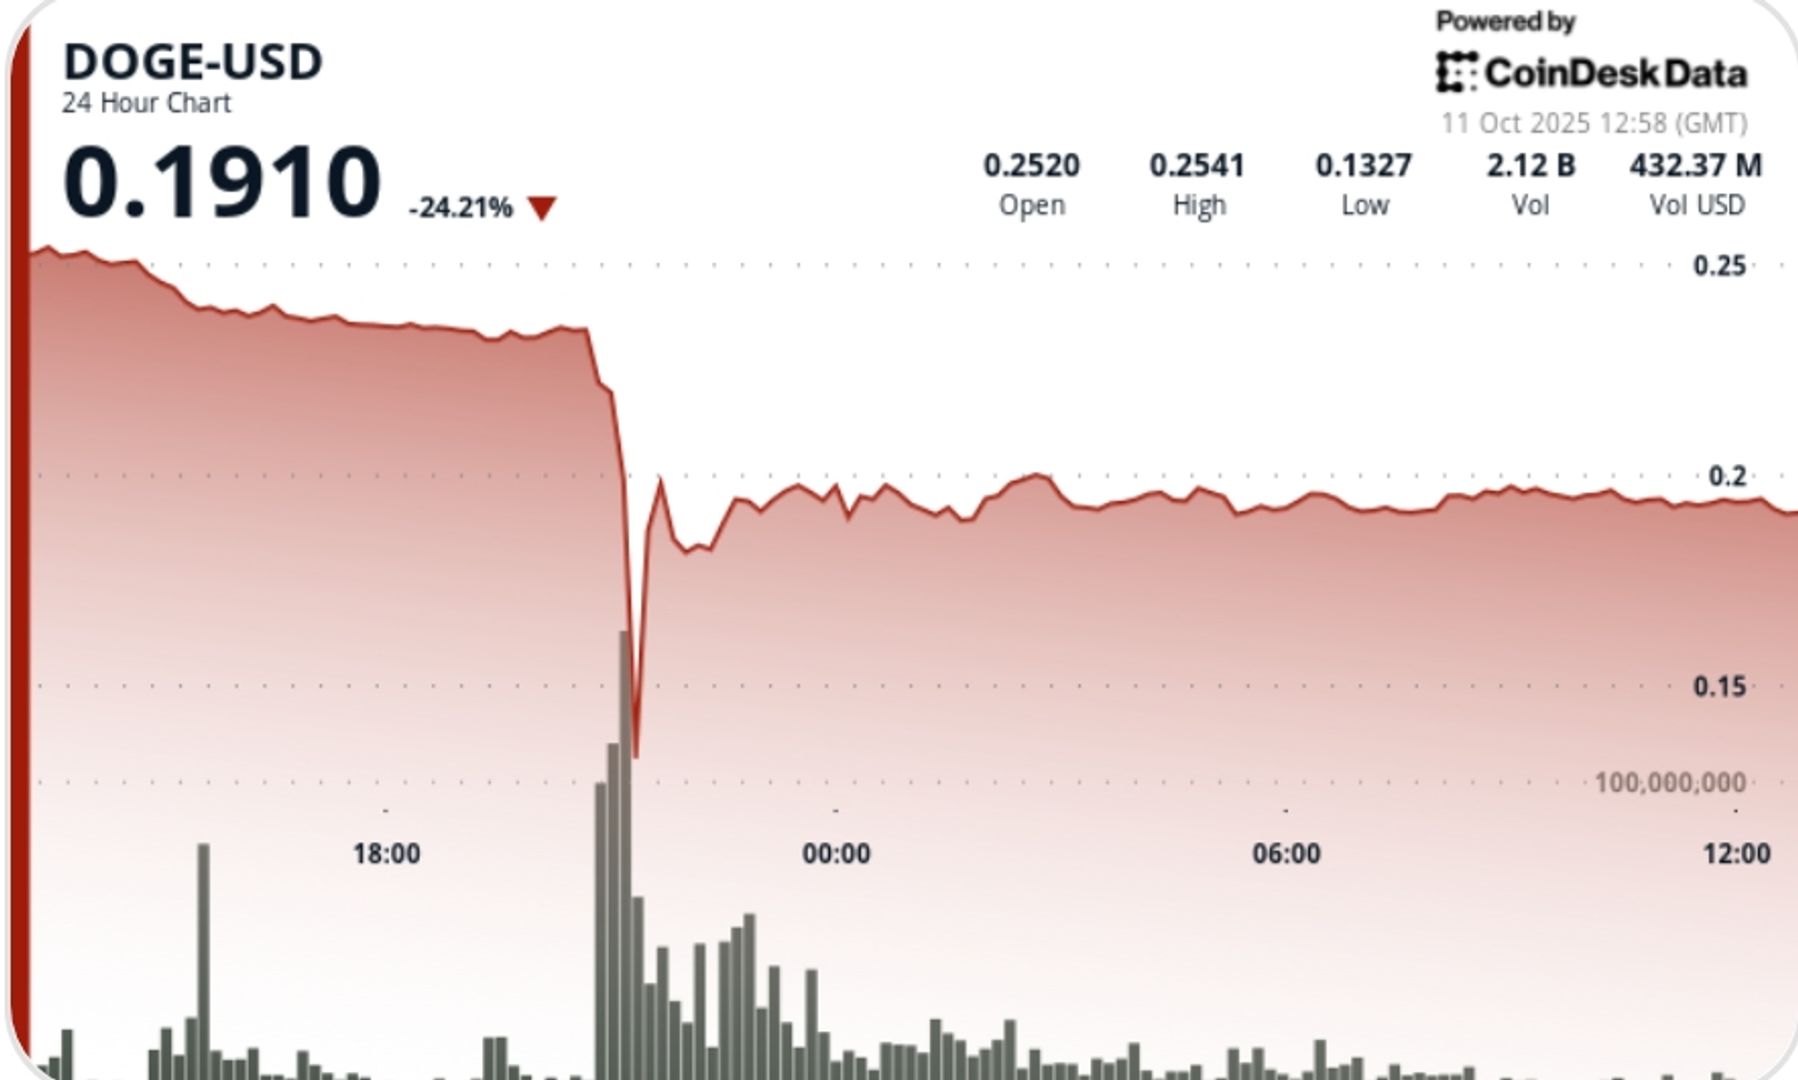
Dogecoin plunged 50% on Friday night in a rare flash crash that saw the price drop from $0.22 to $0.11 in a matter of minutes before bouncing back to the $0.19 to $0.20 area.
What to know
• DOGE fell from $0.22 to $0.11 at 21:00 UTC on October 10 – a sudden 50% drop followed by a recovery to $0.19-$0.20.
• Total intraday range = $0.14 (≈57% volatility), with 4.6 billion tokens traded versus 1.5 billion daily average.
• The Trump administration’s announcement of 100% tariffs on Chinese imports triggered broader crypto risk aversion.
• Last-minute operations showed that the whales were re-accumulating; currency outflows exceeded $23 million and 2 billion DOGE was added to corporate wallets.
• 21Shares launched its institutional DOGE ETF (TDOG), offering the first regulated exposure to the asset.
News background
The move came hours after President Trump’s tariff escalation sparked a cross-market sell-off, affecting both stocks and digital assets. DOGE briefly traded as low as $0.11 on Bitfinex before stabilizing above $0.19 when liquidity desks intervened. Market rumors linked the collapse to leveraged liquidations and automated cross-venue arbitrage failures rather than a fundamental deterioration. Institutional demand re-emerged around $0.19, helped by ETF flows and whale bids rebuilding long exposure.
Price Action Summary
• Sudden drop at 21:00 UTC: DOGE $0.22 → $0.11 (-50%) on a volume of 4.6 billion.
• Recovery to $0.19-$0.20 in a matter of hours as whales absorbed supply.
• Follow-up sale seen at 11:18 UTC on October 11 ($0.1935 → $0.1916, -4%), volume 32 million.
• The session range of $0.14 (57%) marks the highest volatility of the year for DOGE.
• The consolidation of the last hour near $0.193 indicates a cooling, but there is no trend change yet.
Technical analysis
• Support: Formed between $0.19 and $0.20 as institutional flows absorbed panic selling.
• Resistance – Immediate barrier at pre-collapse high of $0.22; Above that, the next targets are $0.25 and $0.30.
• Volume: peak of 4.6 billion vs. 30-day average of 2 billion; capitulation degree rotation.
• Pattern – The double bottom near $0.19 may mark the accumulation zone.
• Momentum – Oversold RSI and expanding Bollinger Bands suggest near-term mean reversion.
What traders are watching
• Will $0.19 remain a reliable support floor or invite another sell-off?
• Can ETF flows and institutional accumulation offset broader macroeconomic risk?
• Whales add ≈2 billion DOGE: signal of value buying or exit from the liquidity trap?
• Post-tariff shock volatility regimes: DOGE returns to 0.25-0.30 range or languishes below 0.20?
• Confirmation of triangle reconstruction above $0.22 would invalidate the bearish structure.


