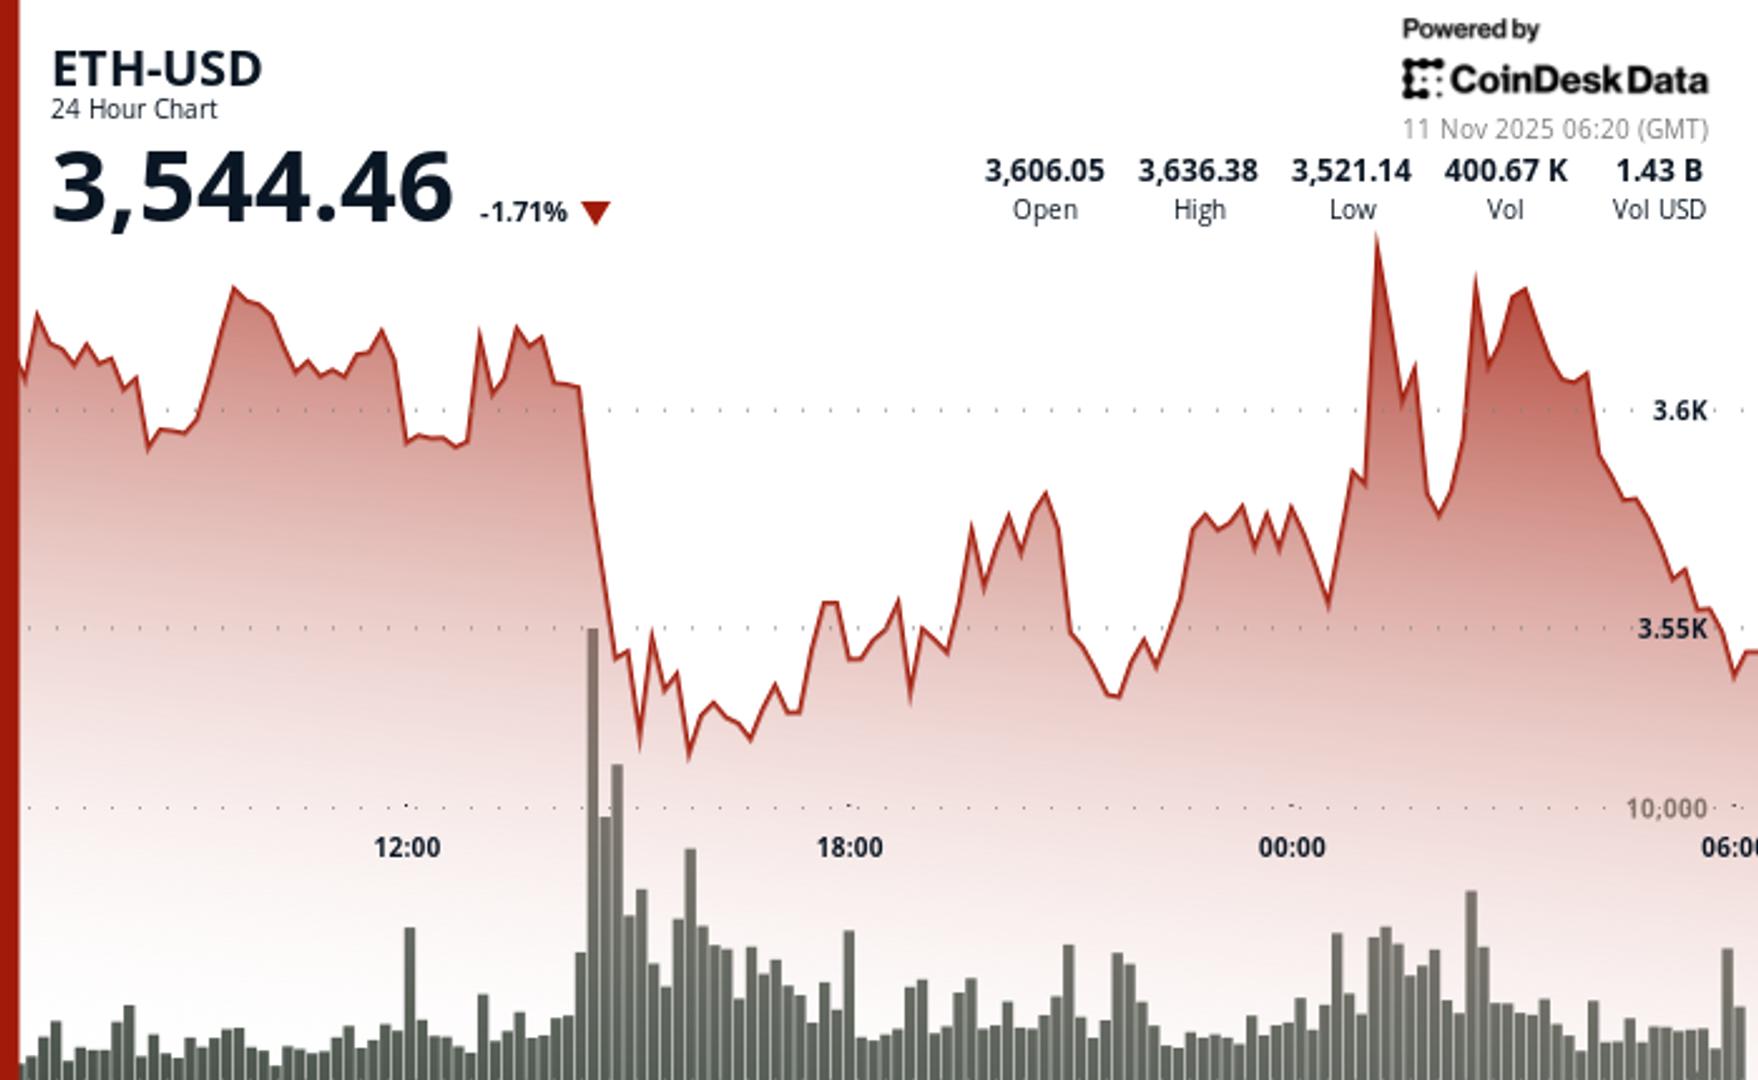
According to CoinDesk Research’s technical analysis data model, Ether it retreated 1.5% during the session on Tuesday as the bears overtook the early bulls near the critical resistance.
ETH fell from $3,629 to $3,576 within a trading range of $136 as sales volume increased 138% above normal levels. The breakdown confirms that the bears now control the near-term direction after weeks of consolidation.
The sell-off accelerated after ETH rejected the $3,646 resistance level during early morning trading. Exceptional volume of 338,852 contracts fueled the decisive break below the $3,590 support. This key level had previously provided reliable demand during recent volatility. ETH touched an intraday low of $3,532 before stabilizing near current levels.
The price action is now showing lower highs despite multiple recovery attempts. The bearish structure emerged after the failed breakout attempt above $3,646. Volume has normalized in recent hours, suggesting that the new trading range of $3,565 to $3,589 reflects genuine institutional selling rather than temporary liquidity gaps.
Technical Breakdown vs Institutional Accumulation: What Traders Should Keep in Mind
Technical factors dominated Tuesday’s session as momentum indicators flashed warning signals on multiple time frames. The rejection of $3,646 triggered cascading stops that overwhelmed recent institutional buying interest. Republic Technologies’ $100 million ETH allocation and BitMine’s 3.5 million token holdings provided insufficient support against the glitch.
The failure of $3,590 support marks a critical shift in market structure for ETH bulls. This level had served as a reliable demand zone during the recent price swings. With momentum deteriorating and volume patterns confirming distribution, traders are now eyeing further tests to the downside before a sustainable recovery emerges.
Key technical levels indicate caution for ETH
Support/Resistance: The main support lies in the $3,510-$3,530 group, with the broken $3,590 level now acting as resistance.
Volume analysis: The breakdown volume of 338,852 exceeded the 24-hour average by 138%, confirming the participation of institutional sales.
Chart Patterns: Formation of a lower high at $3,646 followed by a break of support sets up a bearish continuation setup
Objectives and risk/reward: The immediate downside target is at the $3,510 support, and further weakness towards the $3,480-$3,500 area is likely.
CoinDesk 5 Index (CD5) Market Analysis: Nov 10 03:00 UTC to Nov 11 02:00 UTC
CD5 rose from $1,840 to $1,843 during volatile 24-hour trading that featured extreme price swings and distribution patterns in major crypto assets, with the index touching highs of $1,869 before sellers emerged near resistance levels and brought prices back to session averages.
Disclaimer: Portions of this article were generated with the help of artificial intelligence tools and were reviewed by our editorial team to ensure accuracy and compliance with our standards. For more information, see CoinDesk’s full AI Policy.


