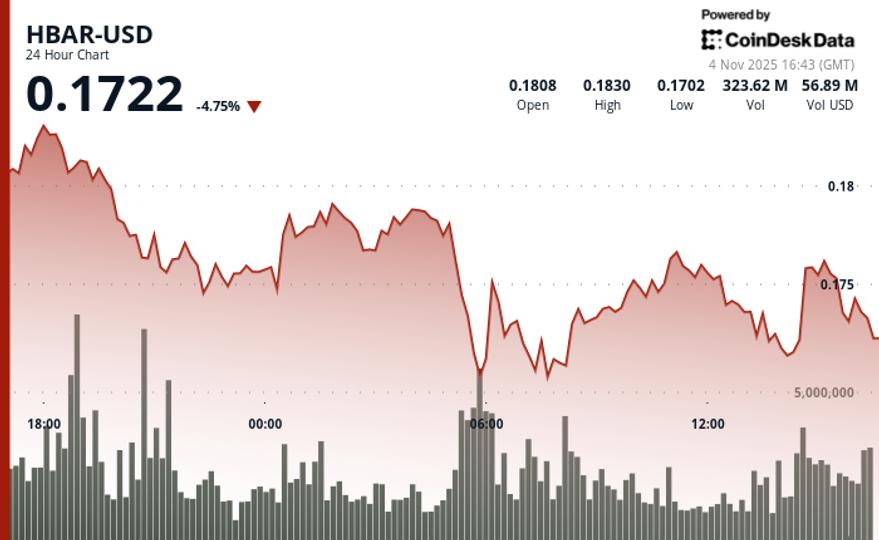
HBAR declined 4.2% in the 24-hour period ending Nov. 4, moving from session peaks of $0.181 to close at $0.173, as technical selling outweighed the ETF’s recent momentum.
The sell-off created a clear bearish structure with lower highs and lower lows throughout the session.
HBAR traded within a range of $0.0131, representing 7.4% volatility. The biggest selling occurred at 05:00 GMT with 171.0 million tokens changing hands (84% above the 24-hour moving average), when prices broke from $0.1775 to $0.1703 and confirmed resistance at $0.1783.
Recent 60-minute data showed that HBAR entered a volatile two-phase trade. Initial selling pressure pushed prices from $0.1755 to $0.1726, followed by an attempted recovery to $0.1763 before a fresh distribution took prices to session lows of $0.1721. Failure to hold above the $0.1740 support indicated broader bearish control despite bounce attempts.
Key technical levels indicate consolidation risk for HBAR
- Primary support remains at the psychological level of $0.1700, with resistance confirmed at $0.1783 after multiple rejection attempts.
- Volume activity is 28.69% above the 7-day average but remains below the 30-day threshold, suggesting routine distribution rather than institutional buying.
- A bearish trend structure forms with lower highs and lower lows, and the break of the $0.1740 support confirms a bearish momentum shift.
- Immediate resistance is at $0.1750, with downside risk extending towards support at $0.1700 aligned with the previous 24-hour consolidation zone.
Disclaimer: Portions of this article were generated with the help of artificial intelligence tools and were reviewed by our editorial team to ensure accuracy and compliance. our standards. For more information, see CoinDesk’s full AI policy.


