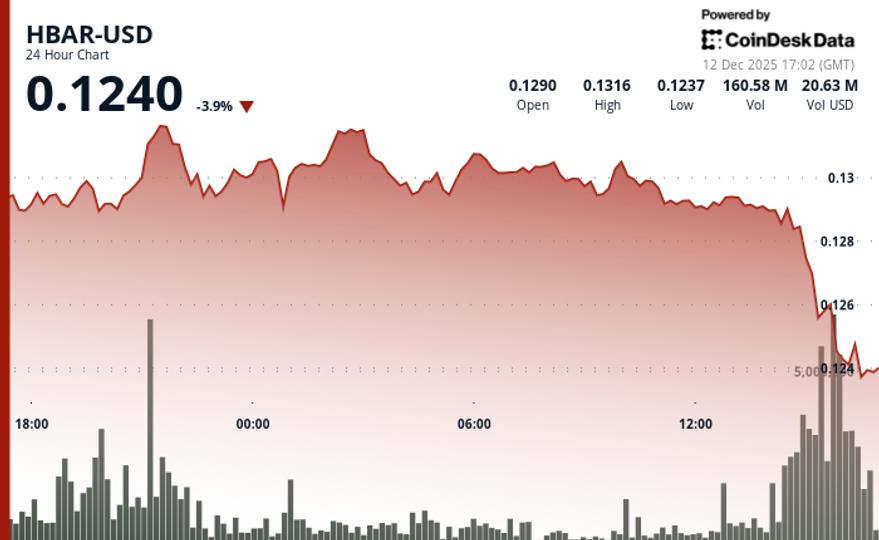
HBAR is trading lower on Thursday after breaking through multiple technical levels during an afternoon sell-off that saw the token fall 4% to $0.1247.
The Hedera network’s native token registers a range of $0.0082 representing 6.4% volatility as the resistance at $0.1320 proves insurmountable for bulls attempting to extend gains.
Volume patterns reveal increased institutional participation throughout the session. The increase in trading activity confirms genuine price discovery rather than the low-liquidity movements characteristic of smaller altcoins.
The afternoon cascade establishes a clear pattern of lower highs from the initial December 11 peak, creating a deterioration in the market structure that accelerates bearish momentum through previously established support zones.
Technical levels of $0.1235 become paramount as HBAR tests critical support following rejection of resistance at $0.1320.
The stabilization pattern around $0.124-$0.125 following a dramatic capitulation creates potential for a mean reversion back to resistance at $0.126.
Traders remain cautious given the decisive break of higher timeframe support levels and exceptional volume during the decline indicating conviction selling. This limits short-term upside potential despite the immediate price recovery providing some relief to bulls.
Key Technical Levels Signal Consolidation Range for HBAR
Support/Resistance:
- Immediate support was established at $0.1235 following the afternoon decline.
- Strong resistance confirmed at $0.1320 after multiple rejection attempts.
- The new trading range is between $0.123 and $0.125 on 60-minute time frames.
Volume analysis:
- Exceptional rise to 165.9 million tokens (175% above 24-hour average) during key reversal.
- The 60-minute sudden accident volume peaked at 15.7 million (700% above the hourly average).
- Sustained activity above average confirming institutional participation.
Chart Patterns:
- Pattern of lower highs established from the December 11 peak creating a bearish structure.
- Sudden drop and recovery formation suggesting accumulation near support.
- Deteriorating momentum across multiple support levels indicates a trend reversal.
Objectives and risk/reward:
- Immediate bullish target at the $0.126 mid-reversion level.
- Risk of falling to the support floor of $0.123 if the current consolidation fails.
- Key resistance remains at $0.1285, where the initial breakout occurred.
Disclaimer: Portions of this article were generated with the help of artificial intelligence tools and were reviewed by our editorial team to ensure accuracy and compliance with our standards. For more information, see CoinDesk’s full AI Policy.


