bitcoin fell to as low as $86,000 when CME futures opened on Sunday after the weekend pause. It has since recovered slightly, although the market structure remains firmly in a bearish trend.
This initial drop created a price gap that extended to $89,265. A CME gap forms when the bitcoin spot price moves while CME futures are closed. Historically, bitcoin has shown a tendency to bridge these gaps.
Bitcoin last hit an all-time high on October 6, 111 days ago, and is now down about 30% from that peak, reinforcing bearish momentum.
A break below $80,000 would likely introduce a review of April 2025 levels, when bitcoin traded as low as $76,000 during the sell-off linked to President Donald Trump’s tariff campaign.
For now, the key level holding the market together is the 100-week moving average, which represents the average closing price over that period and is often considered long-term structural support. Since the local low on November 21 at $80,000, the price has consistently remained at this level, which is currently close to $87,145.
Bitcoin has already fallen below the 50-day moving average of just over $90,000. This indicator is commonly used to measure the direction of the short-term trend.
Below current levels, several notable support zones emerge. The difficulty regression model, an estimate of the average production cost of bitcoin based on mining difficulty, stands at around $89,300. Historically, commodities tend to gravitate toward or trade below their cost of production during bear markets.
Further down, the aggregate cost basis of buyers of US spot bitcoin exchange-traded funds is $84,099, a level that has acted as support for several months. Onchain data shows the average exchange withdrawal price in 2024, effectively the 2024 buyers’ cost base, at $82,713.
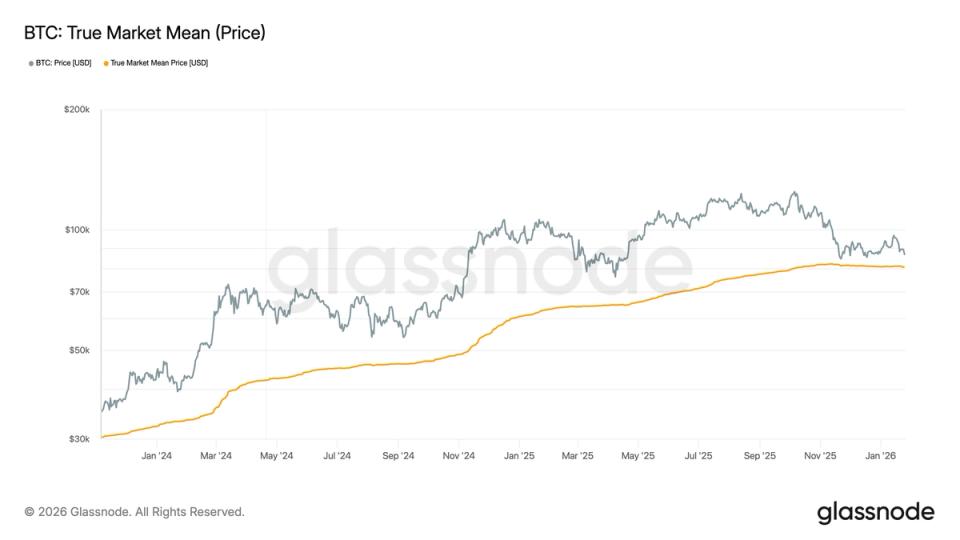
Finally, the actual average market price, calculated using the investment limit divided by active supply, sits just above $80,000, closely aligning with the November low and reinforcing its importance as a potential mean reversion level.


