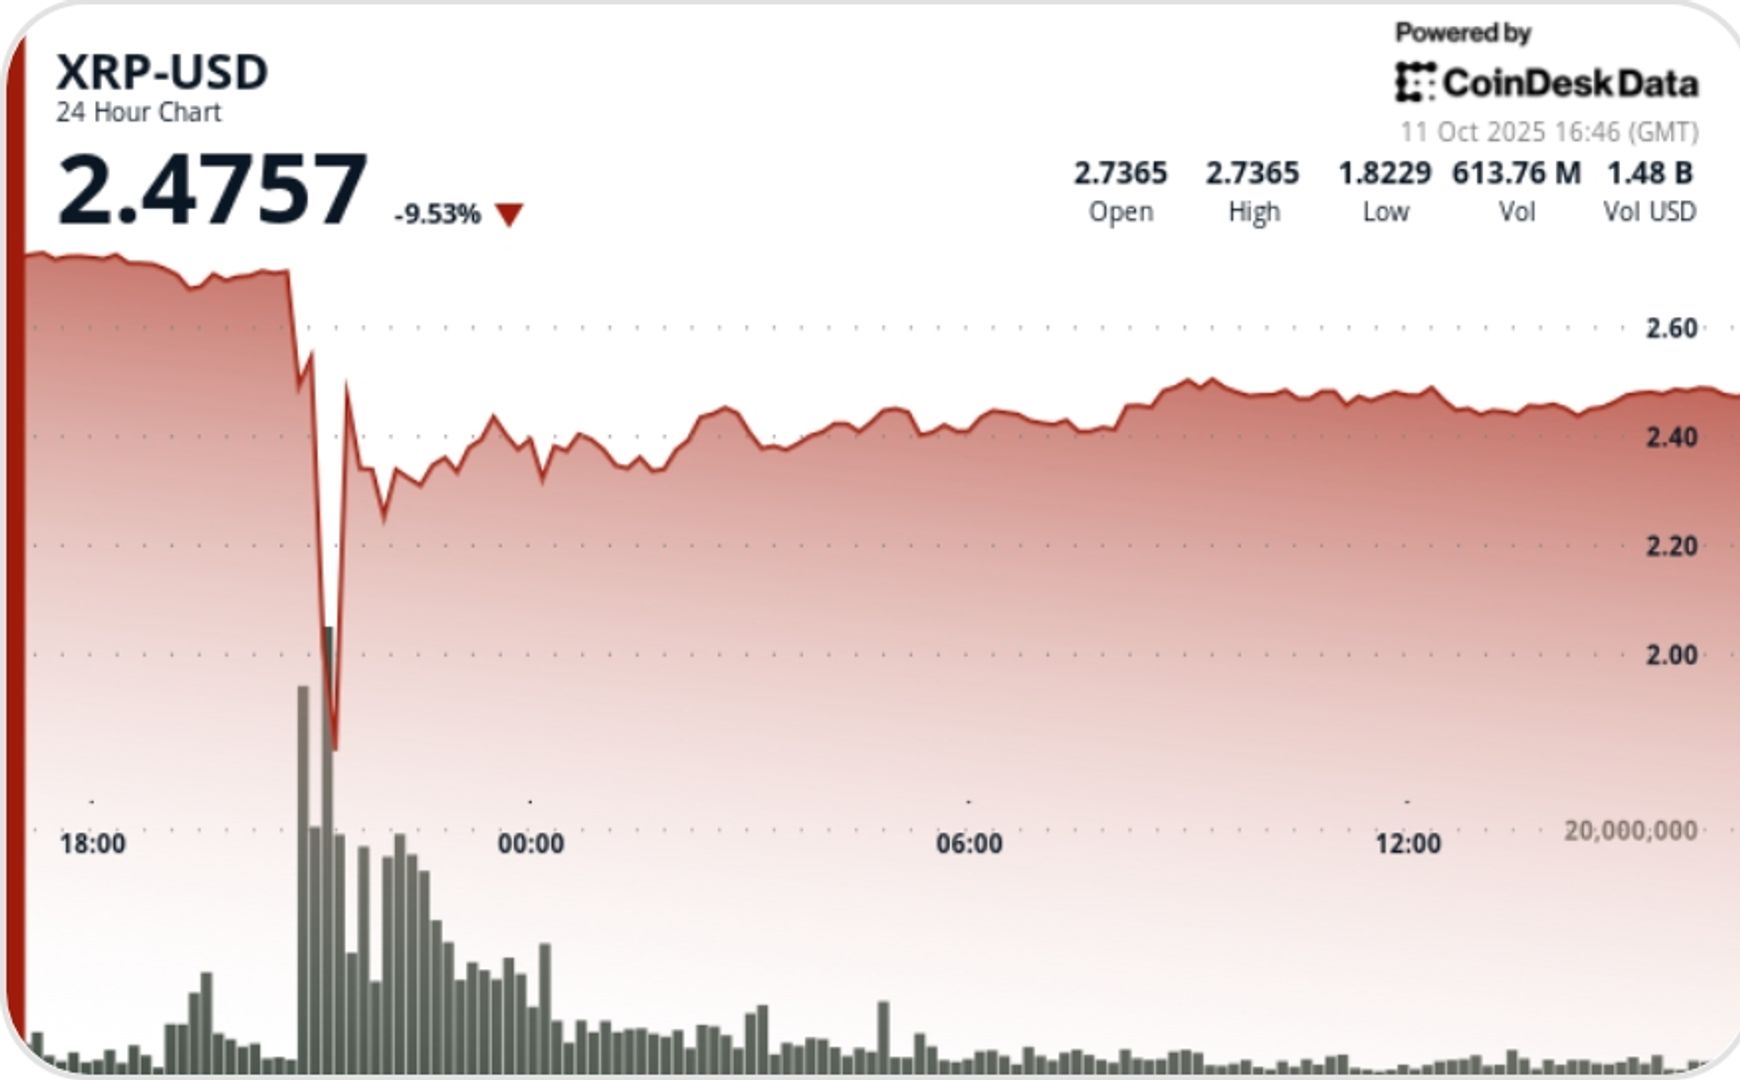
XRP recouped losses in chaotic trading on Friday, recovering from a 41% collapse to close above $2.47 as institutional bids rebuilt following panic sell-offs. The session’s $1.14 range ($2.77 to $1.64) was one of the widest in XRP’s trading history in 2025, driven by macro deleveraging and strong futures sell-offs in major venues.
What to know
• XRP fell from $2.77 to $1.64 between October 10 16:00 and October 11 15:00, marking a 41% intraday collapse before rebounding to $2.49.
• Over $150 million worth of XRP futures were liquidated as Trump’s 100% tariff announcement triggered risk aversion across assets.
• Intraday volume exceeded 817 million (almost triple recent daily averages) while volatility peaked at 41%.
• Institutional accumulation is between $2.34 and $2.45 as large holders rebuilt their exposure following the rebound.
• Key resistance remains at $3.05, with bullish projections between $3.65 and $4 if recovery momentum is maintained.
News background
The sudden macroeconomic shock (the new tariffs between the United States and China) triggered forced liquidations in all risk assets. XRP briefly plunged to $1.64 before stabilizing as volume-weighted bids absorbed panic selling. Derivatives data confirmed the capitulation: open interest fell 6.3% overnight, while long liquidations outpaced short liquidations 15:1. Analysts framed the rally as an “institutional recalibration” rather than retail-driven volatility, and Treasuries added spot exposure to the $2.40 zone amid ETF inflows and improving sentiment around Ripple’s banking integrations.
Price Action Summary
• The steepest drop occurred between 19:00 and 21:00 UTC, when XRP fell $1.08 on volume of 817 million – the week’s capitulation candle.
• The immediate rebound to $2.34 created a new base; The price then rose steadily to $2.49 at 15:00 UTC.
• The last hour (14:58–15:57) saw a band of $0.03 ($2.46–$2.49) on volume of 2.2 million: evidence of consolidation, not outflows.
• The market structure was rebuilt with between $2.47 and $2.48 as short-term support, confirming the absorption of previous volatility.
Technical analysis
• Support – $1.64 remains capitulation low; $2.40–$2.45 forms the accumulation floor.
• Resistance – $3.05 remains the breakout trigger; Closing above indicates a structural recovery.
• Volume – 817 million vs. 30-day average ≈ 270 million – capitulation degree turnover.
• Pattern – A bullish recovery channel develops; Momentum indicators turn positive above $2.47.
• Trend – RSI recovered from oversold; The MACD histogram turns towards zero, showing an early reversal bias.
What traders are watching
• If the $2.47 area remains confirmed support during the weekend’s Asian sessions.
• Offers for continuation of institutional tables in the post-liquidation phase.
• ETF related flow data after 21Shares TDOG launch spill.
• Technical break above $2.90–$3.00 to re-enter long positions with a target of $3.65+.
• Macro Risk Narrative: Track tariff escalation and crypto correlation spikes.


