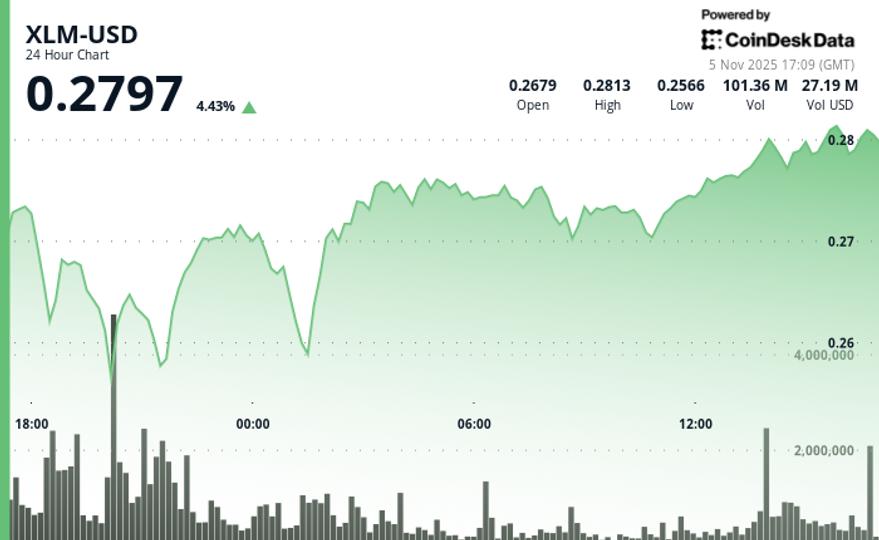
Stellar (XLM) posted modest gains in the Tuesday session, rising 0.97% to $0.279 and outperforming the broader crypto market by 1.84%. The move came despite overall market caution, indicating selective buying interest and relative strength of the token.
Trading volume increased 59.61% above its seven-day average, marking a notable uptick in participation that often precedes larger directional moves. This increase in activity points to institutional repositioning rather than short-term speculation, as traders appeared to accumulate positions amid a contained bullish trend.
Technical indicators show that XLM fell to test support near $0.256 before recovering throughout the day. The token maintained an ascending pattern with a 9.4% range and consistent higher lows, reinforcing a constructive setup. The maximum trading volume reached 127.2 million tokens during the test of support (88% above the daily average), confirming the strength of buyers at lower levels.
Short-term charts revealed that The breakout, backed by more than 1 million tokens traded per minute at its peak, indicates professional accumulation and sustained momentum rather than retail-driven speculation.
Key Technical Levels Signal XLM’s Continuation Potential
Support/resistance analysis:
- Primary support was confirmed at $0.256 with strong volume validation.
- The advance of the resistance was verified at USD 0.281 during the acceleration of the last hour.
- Secondary support levels marked at $0.266, $0.270 and $0.276.
Volume analysis:
- The volume increase of 59.61% above the weekly average shows institutional participation.
- Peak activity reached 127.2 million tokens during the support testing phase.
- The last hour’s volume exceeded one million tokens per minute during the breakout.
Chart Patterns:
- Ascending pattern with consistent higher lows over a 24 hour period.
- The total range of $0.026 (9.4%) shows an environment of controlled volatility.
- Breakout momentum was confirmed above the $0.281 resistance level.
Objectives and risk/reward:
- The next technical target is projected near $0.285 based on breakout momentum.
- The main downside risk lies at the support level of $0.276.
- The ascending pattern indicates a potential for continued upward momentum.
Disclaimer: Portions of this article were generated with the help of artificial intelligence tools and were reviewed by our editorial team to ensure accuracy and compliance. our standards. For more information, see CoinDesk’s full AI policy.


