Bitcoin The implied volatility (IV) indicator has risen to a 2.5-month high, in line with seasonal trends.
Volmex’s bitcoin implied volatility index, BVIV, which represents expected price turbulence annualized over four weeks, has surpassed 42%, the highest since late August, according to data source TradingView.
IV measures the market’s expectations of future price swings based on the options price. A higher IV suggests that traders are anticipating larger price movements in the future.
BVIV rose earlier this month alongside a rally in the price of BTC and has continued to rise despite the latest pullback from the all-time high of over $126,000 to around $120,000.
Bullish seasonality
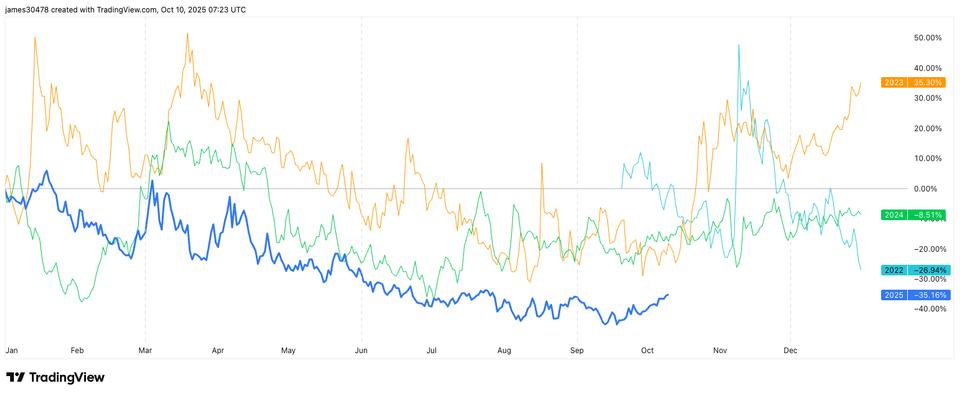
BVIV historical data shows that the index tends to skyrocket this time of year. Both 2023 and 2024 saw significant increases in volatility in October, highlighting a recurring seasonal pattern.
CoinDesk Research notes that the 2025 volatility configuration closely reflects that of 2023, when it was not until the second half of October that IV began its next major bullish leg, going from 40% annualized to more than 60%.
The same goes for the spot price. Historically, the second half of October offers stronger returns than the first.
According to Coinglass data, bitcoin has averaged roughly 6% gains each week over the next two weeks, which are among the most bullish periods of the year. November is typically the best performing month, historically generating returns of over 45% on average.
The expectation for the coming weeks is for the IV to increase from this current range.
Broader inverse relationship
Since late last year, BTC’s IV has tended to rise more often than not during price pullbacks in a classic Wall Street-like dynamic. The inverse relationship is evident from IV’s persistent downtrend since late last year and the broader uptrend in prices.
As bitcoin matures as an asset, the law of diminishing returns suggests that price gains will gradually reduce and volatility will also decrease over time. Zooming out, the BVIV model shows a clear long-term bearish trend in implied volatility since the metric was first introduced.


