Some worry about bitcoin We could still see a deeper sell-off, but one key indicator suggests we may already be past the bottom.
That indicator is 30-day implied volatility, which is an options-based measure of expected price turbulence over four weeks.
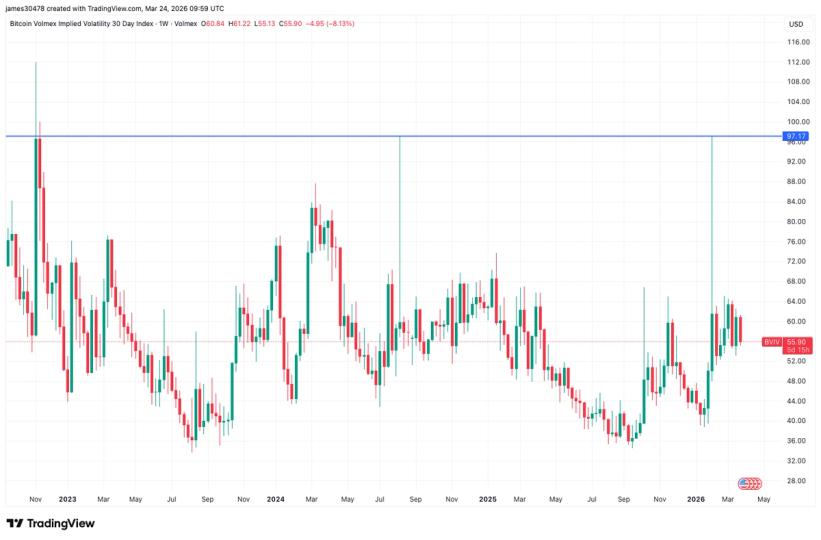
Widely followed 30-day implied volatility indices such as Deribit’s DVOL and Volmex’s BVIV rose to 90% in early February, when bitcoin plummeted to nearly $60,000. Historically, similar spikes in volatility have coincided with spikes in panic and capitulation, marking price bottoms.
VIX type contrary signal
The structure of the Bitcoin market has been increasingly reflected on Wall Street since the introduction of BTC spot ETFs in the US in early 2024.
In this context, implied volatility has emerged as a “fear gauge” and contrarian indicator similar to the VIX, a real-time indicator that measures the 30-day expected volatility of the S&P 500: it typically trends downward in stable markets, but rises sharply during times of extreme fear that mark major market lows.
This dynamic became evident early last month when Bitcoin plummeted. The resulting panic demand for options, mostly puts, drove DVOL and BVIV skyward to 90% or more, in a manner consistent with previous capitulation events, such as August 2024, when prices plummeted and bottomed near $50,000.
The same thing happened in November 2022, when FTX crashed, triggering a fear spike and raising implied volatility to 90%. At that time, bitcoin bottomed below $20,000.
So, if history is any guide, the bitcoin bearish trend that began in October with highs above $126,000 is now over.
Some might argue that one indicator doesn’t prove much and that’s logical. But what makes it noteworthy is its established role in traditional markets as a contrarian indicator.
A super high VIX, well above its long-term average, is generally considered a strong contrarian buy signal for long-term investors as it represents peak market fear and “panic.”
In fact, many Wall Street strategies use the VIX as a “background indicator” to trigger systematic stock purchases. For example, quantitative mean reversion funds use models where a ViX that deviates significantly from its long-term average triggers an automatic increase in stock leverage.
Speaking of the VIX, it hit a one-year high of 35% on March 9, almost a month after bitcoin’s volatility exploded. The VIX has risen throughout 2026, but has remained below previous dislocation peaks above 60, seen during Liberation Day in April 2025.


